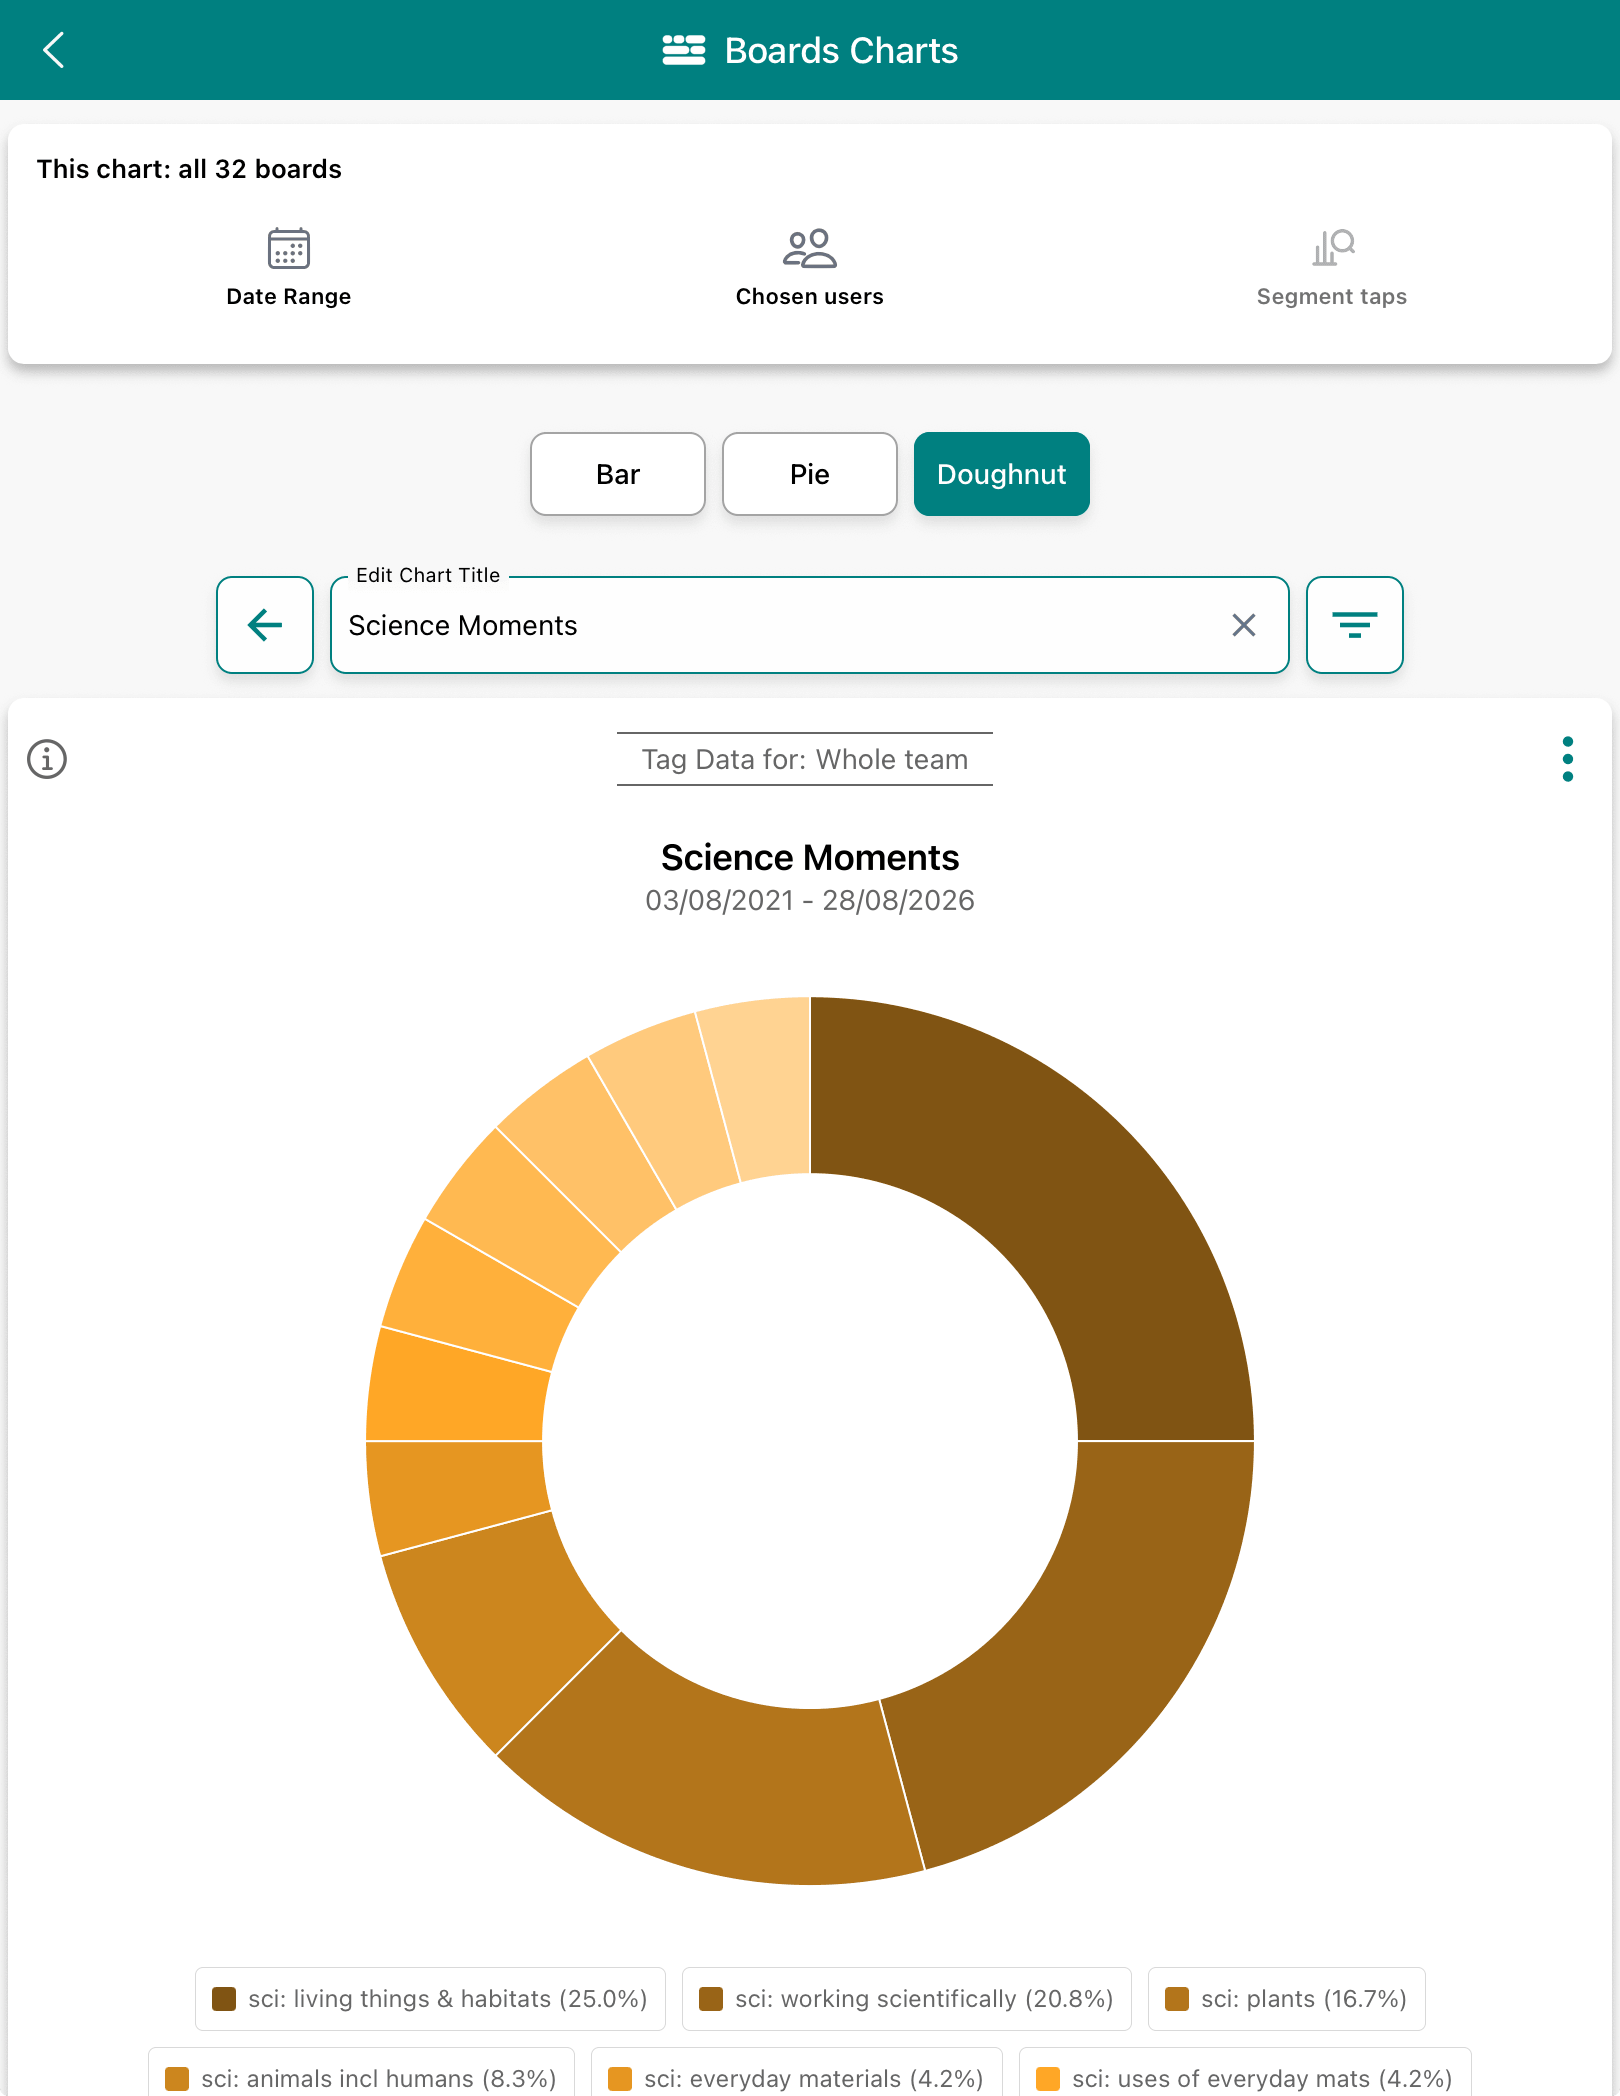
Charts in the Blippit Boards app are interactive in different ways. For example:
Edit the chart title to suit your context by tapping the default title (Science Moments in this case) to type a new one. Click 'away' from your title to make it update.
Select a date range to choose what period you want data to cover
Select a chosen user (teacher) to see a chart for a specific person's moments
Select Segment taps to choose whether you drill into the data or go see the boards behind the data
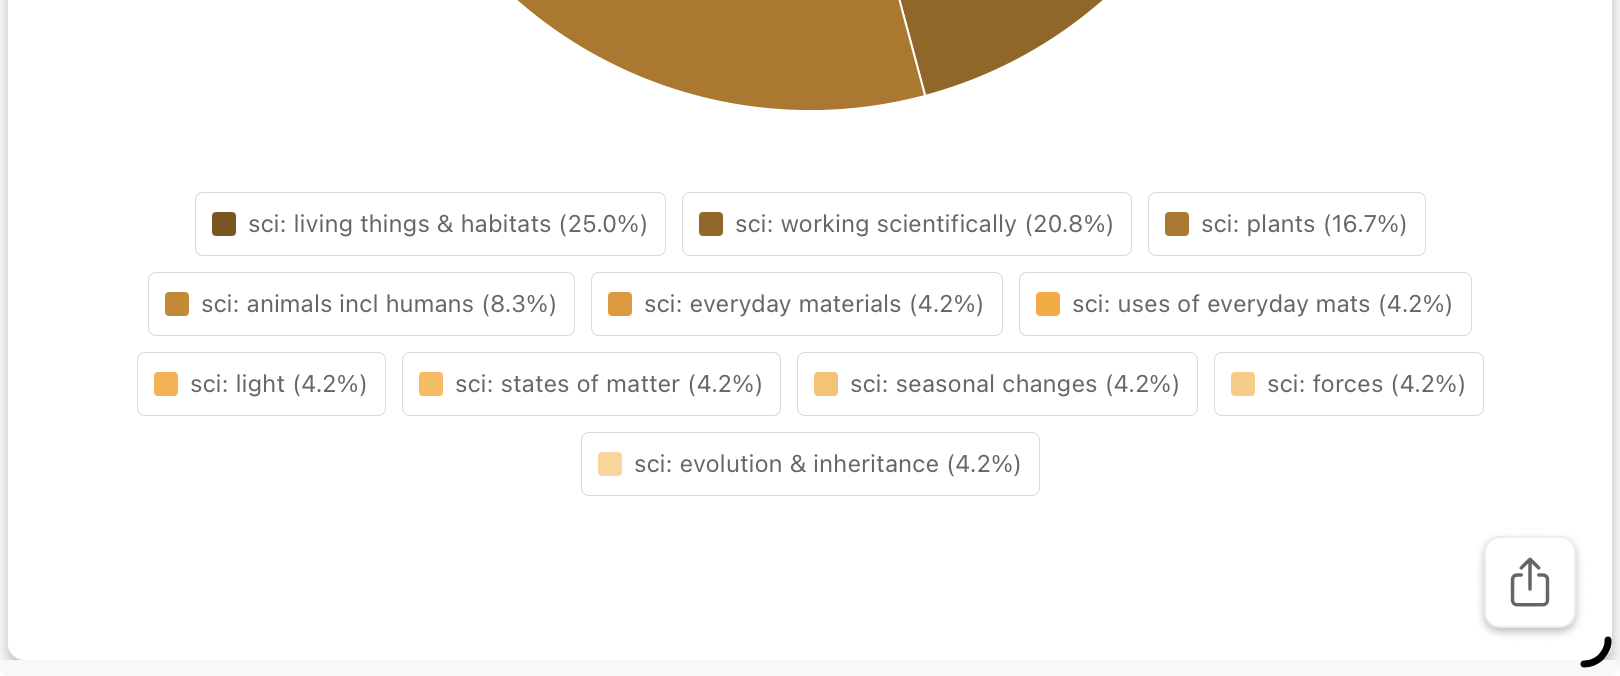
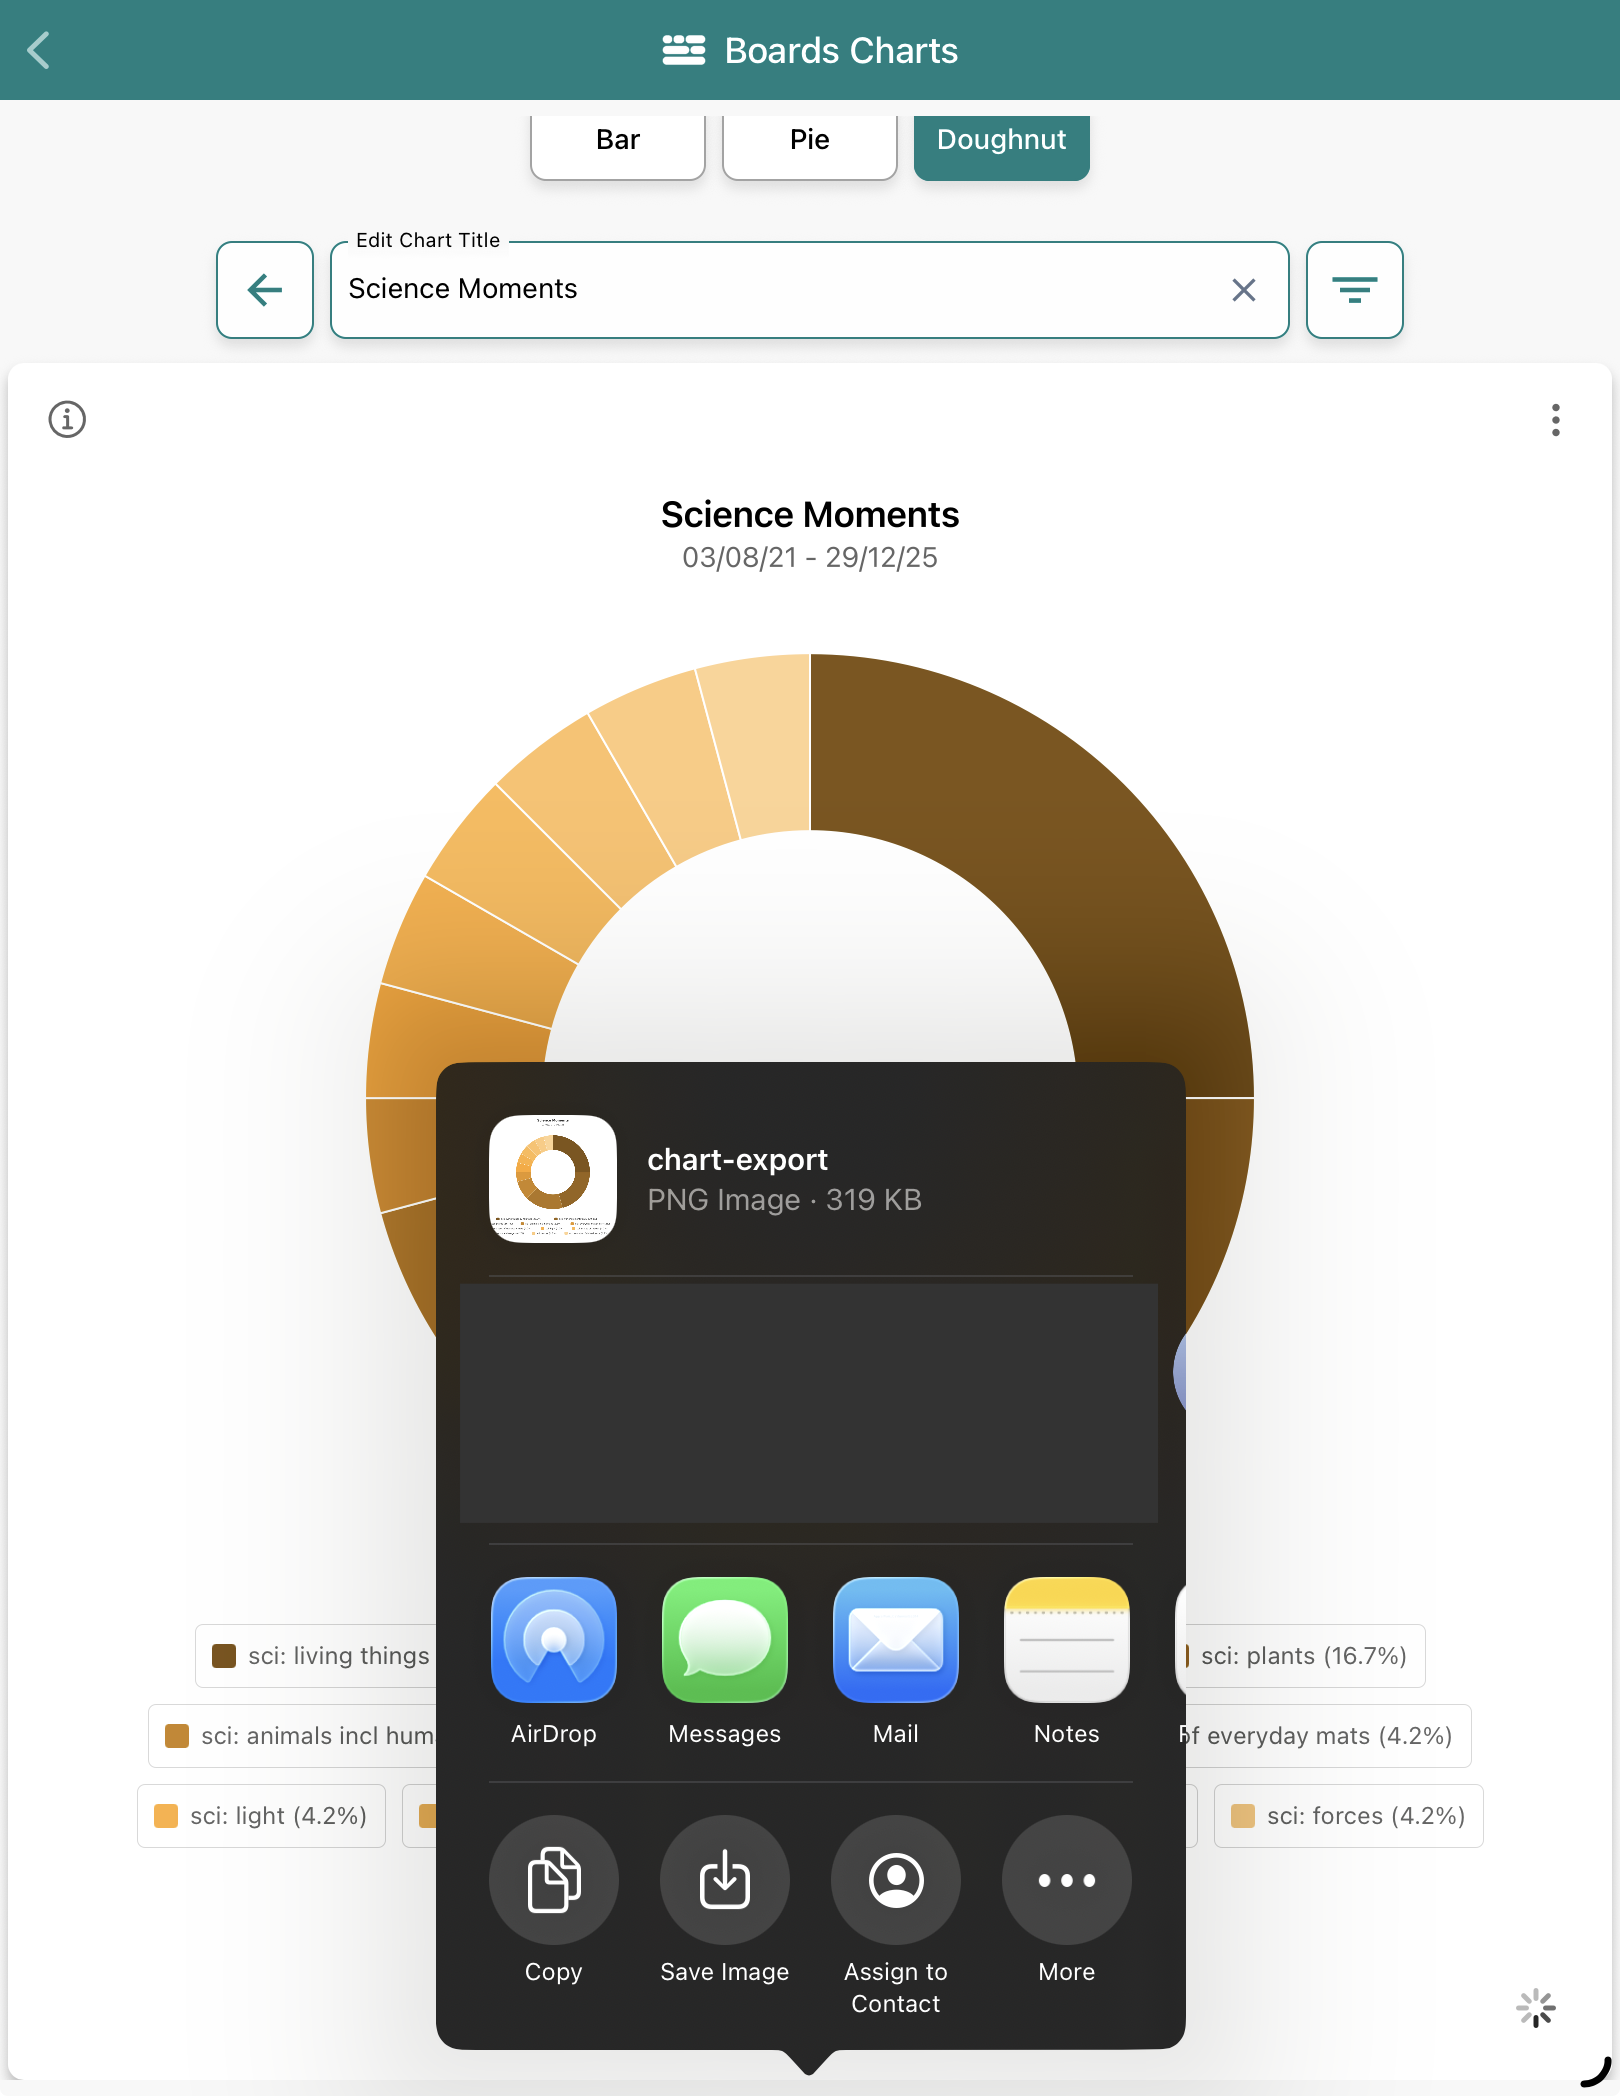
How to share a chart
Tap the share icon below the chart in the bottom right corner and share as normal via email or other channel.