Keep up with all of the latest updates and stories coming out in 2026.
Summary
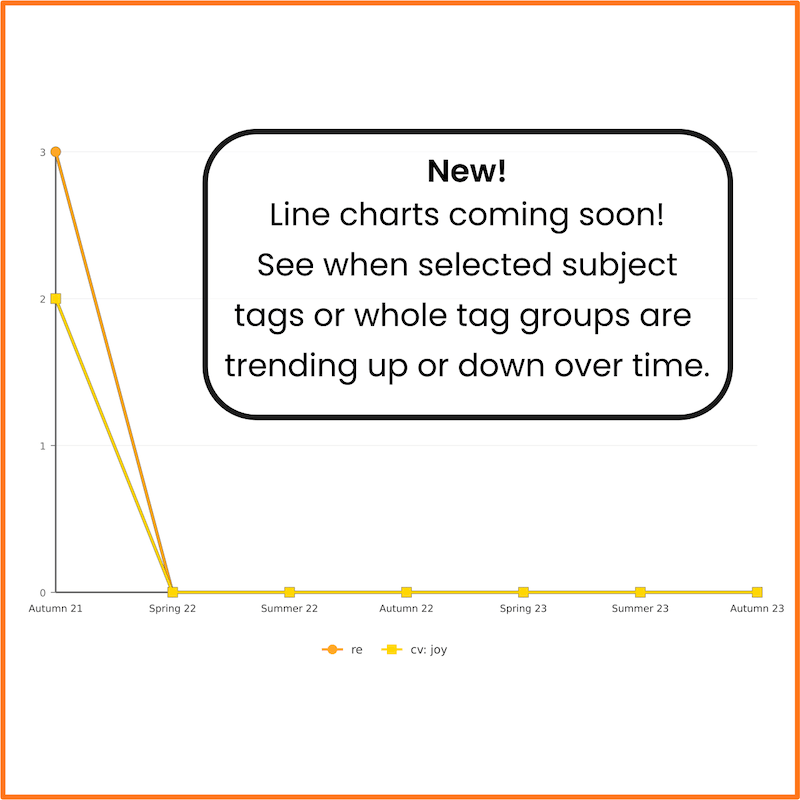
Our new Line charts give you another way to look at the curriculum moments you’ve captured in Blippit Boards. Rather than simply seeing how many Boards you have for a subject, theme or priority, you can now see how those moments have been spread across the school year. It’s a useful way to spot patterns, bursts of activity or quieter periods that might otherwise be easy to miss, and decide whether there’s anything you want to explore further.
Summary
Blippit Boards v3.3.0 introduces ‘Contributors’, a new feature shaped directly by feedback from a teacher looking for a way for EYFS staff to collaboratively build shared exemplification boards. Staff can now contribute observations, evidence and examples to the same board while keeping ownership and structure clear. The feature reflects the collaborative way teachers already work across teams, phases and subject areas.

Summary
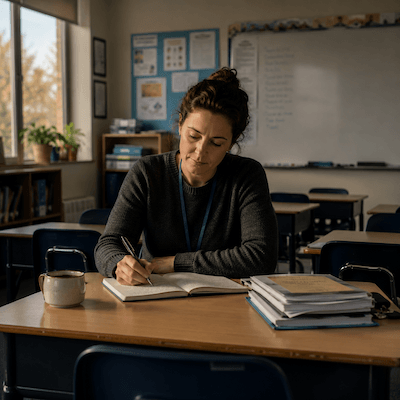
Teacher wellbeing has fallen to its lowest level since 2019, yet many reflective tools still focus more on reassurance than understanding. This article explores the difference between validation and meaningful reflection, and why teachers may need more than generic encouragement after a difficult day. It also looks at the quieter role AI may be able to play in helping teachers process emotionally complex moments with greater clarity.
Summary
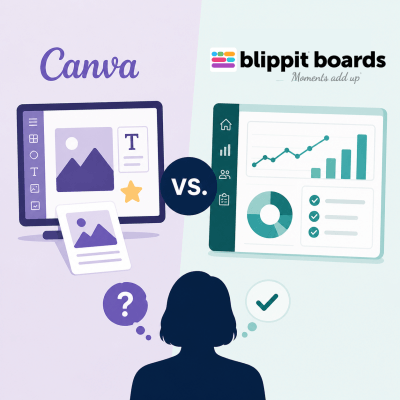
A Head told us that they were using Canva instead of Blippit. It wasn’t really about the tools. In many schools, decisions like this reflect workload, familiarity, and cost - not curriculum insight. This post explores what’s really behind that shift, how those decisions are made under pressure, and why capturing evidence isn’t the same as really seeing and understanding what’s happening across your curriculum.
Summary
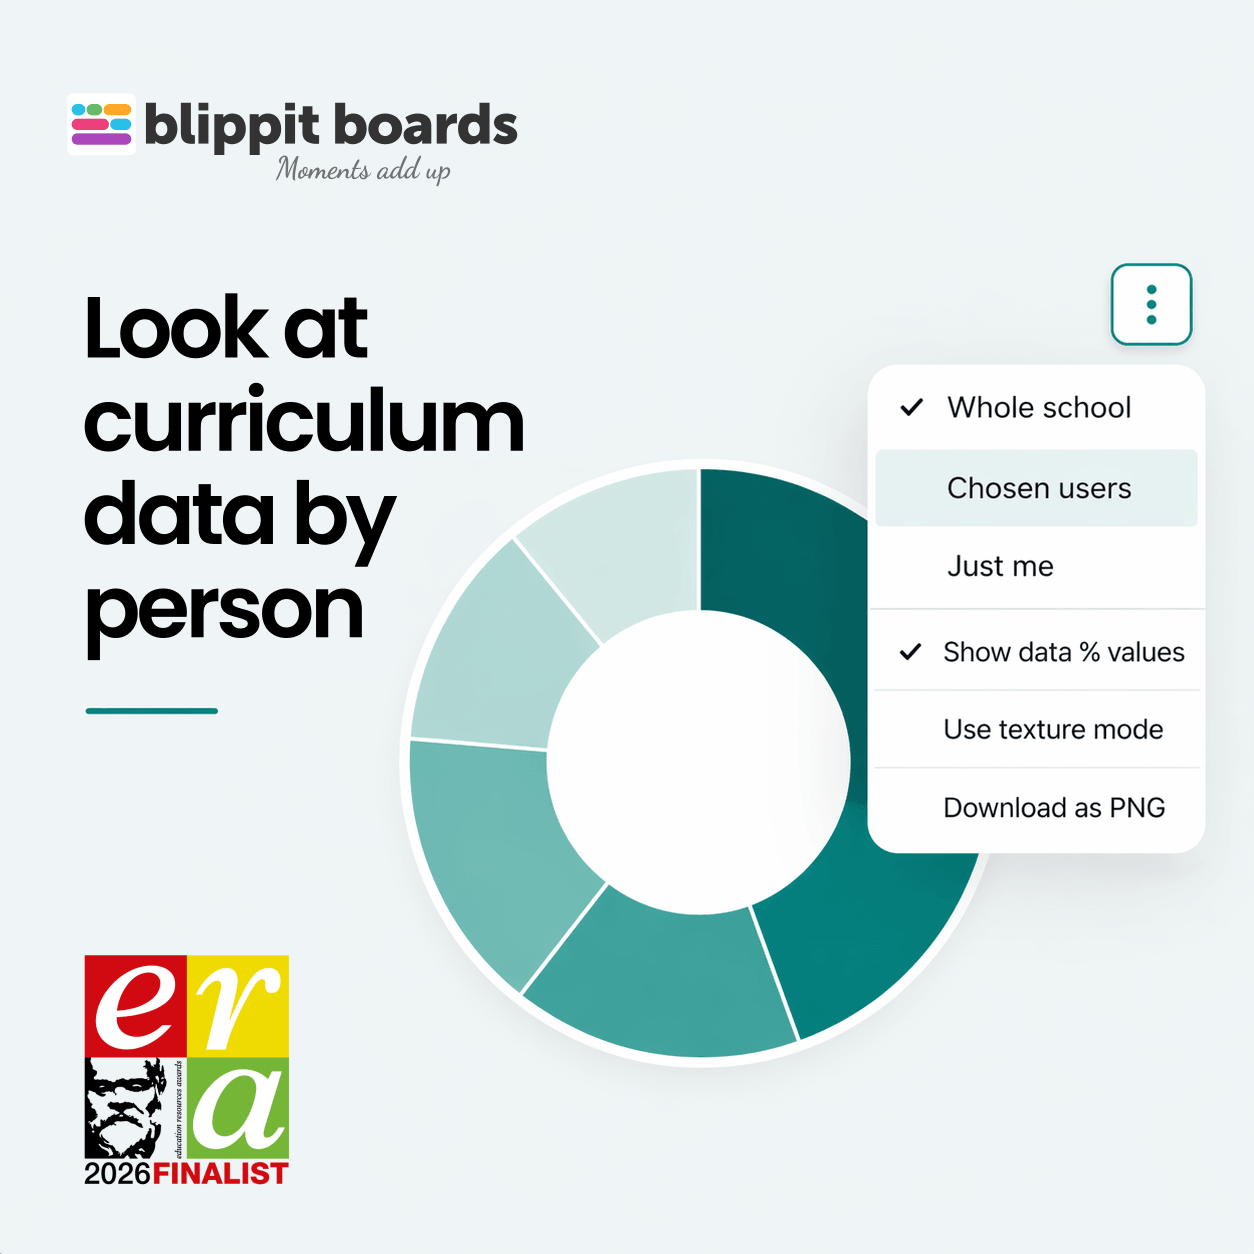
Blippit Boards now allows you to filter curriculum and behaviour data by individual teachers or selected groups. Previously limited to whole-school, key stage, or year group views, this update gives school leaders, subject leaders, and teachers a clearer way to analyse how moments are recorded across staff. By viewing data at a person level, it becomes easier to identify patterns, understand curriculum coverage, support monitoring conversations, and review teaching activity with greater accuracy