
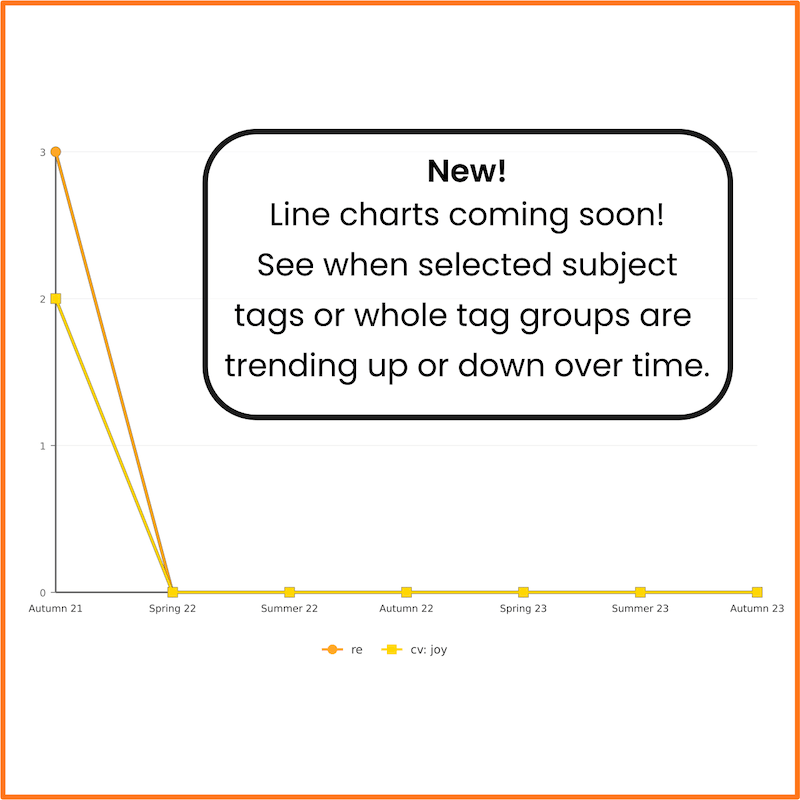
Trends are coming to Blippit Boards in our next app update.
Here's what's new: line charts that show how your tags are trending over time. Filter your boards as you normally would, tap the chart icon, and you'll get a line for each tag you've filtered to. Board counts up the side, school weeks along the bottom, holidays skipped so the shape isn't thrown off by half term. It opens on the current term by default, and a handful of tags keeps it readable.
The charts you already have answer "how many", and that's very useful. But a total doesn't tell you when. For that, you currently have to filter a date range and tag and view your timeline, which is fine but having a streamlined version of this will save a lot of visual sifting and thinking.
Say for example you lead music. You know you've got a decent number of boards for the year that include many great moments from the curriculum. The line chart shows most of them landed in the fortnight either side of the Christmas production, but almost nothing since February half term in KS 2. That's not something a total will ever show you, and it's exactly what you want to know before putting out feelers directly..
It works for any tag or group, so handwriting, SEND provision, an enrichment strand, whatever you're keeping your finger on the pulse of.
We're aiming to release this later in September, all being well. We'll let you know in the app as soon as it lands.
Write about something from your classroom and get structured thinking back - privately, in two minutes, with no sign-up.
Try a free reflection →No account needed. Not stored by Blippit.