

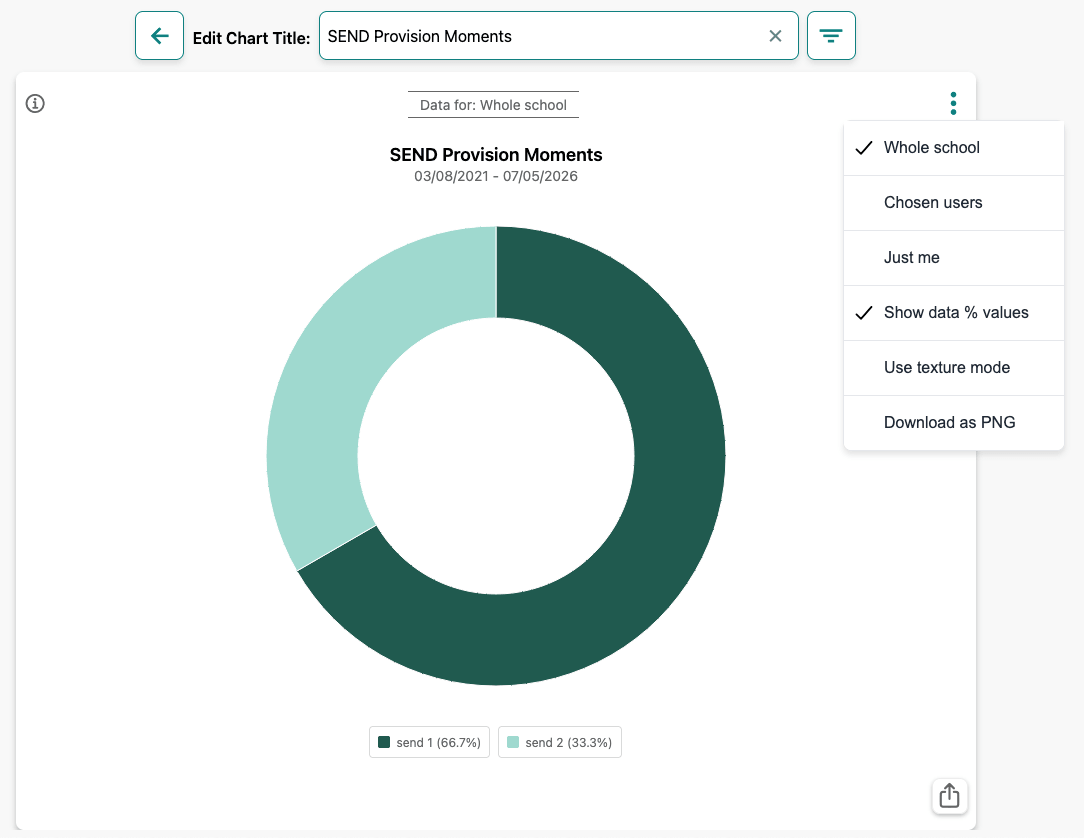
The SEND Provision chart (once you've actually got a range of moments tagged with SEND Provision tags) shows where SEND support has been recorded as the context in which moments are being shared to teachers' boards. Teachers can also run a report to get a more comprehensive AI-assisted narrative about SEND provision moments as shared in Blippit Boards
SEND 1-4 tags are generic labels used to represent targeted provision groups in your school. You might only use the 'send 1' tag to correspond with one provision group, while others might need to use 'send 2' 'send 3' or even 'send 4' depending on how provision is organised.
1. Key Stage
Does SEND provision appear more often in certain stages of the school?
Filtering by Key Stage allows you to see whether provision is appearing more frequently in:
This can help identify patterns in when support is most commonly recorded across the school and supports possible follow-up thoughts and actions about
2. Year Group
Are particular year groups generating more SEND provision moments?
Filtering by Year Group allows you to explore patterns within specific cohorts.
For example:
Possible follow-up thinking might be
3. Subject
In which subjects is SEND provision most often being recorded?
Filtering by subject shows the curriculum contexts where SEND support is appearing.
For example:
Possible follow-up thinking
Every chart segment can be tapped to show you the moments on boards that generated the data, allowing you to review the moments where SEND provision was recorded.
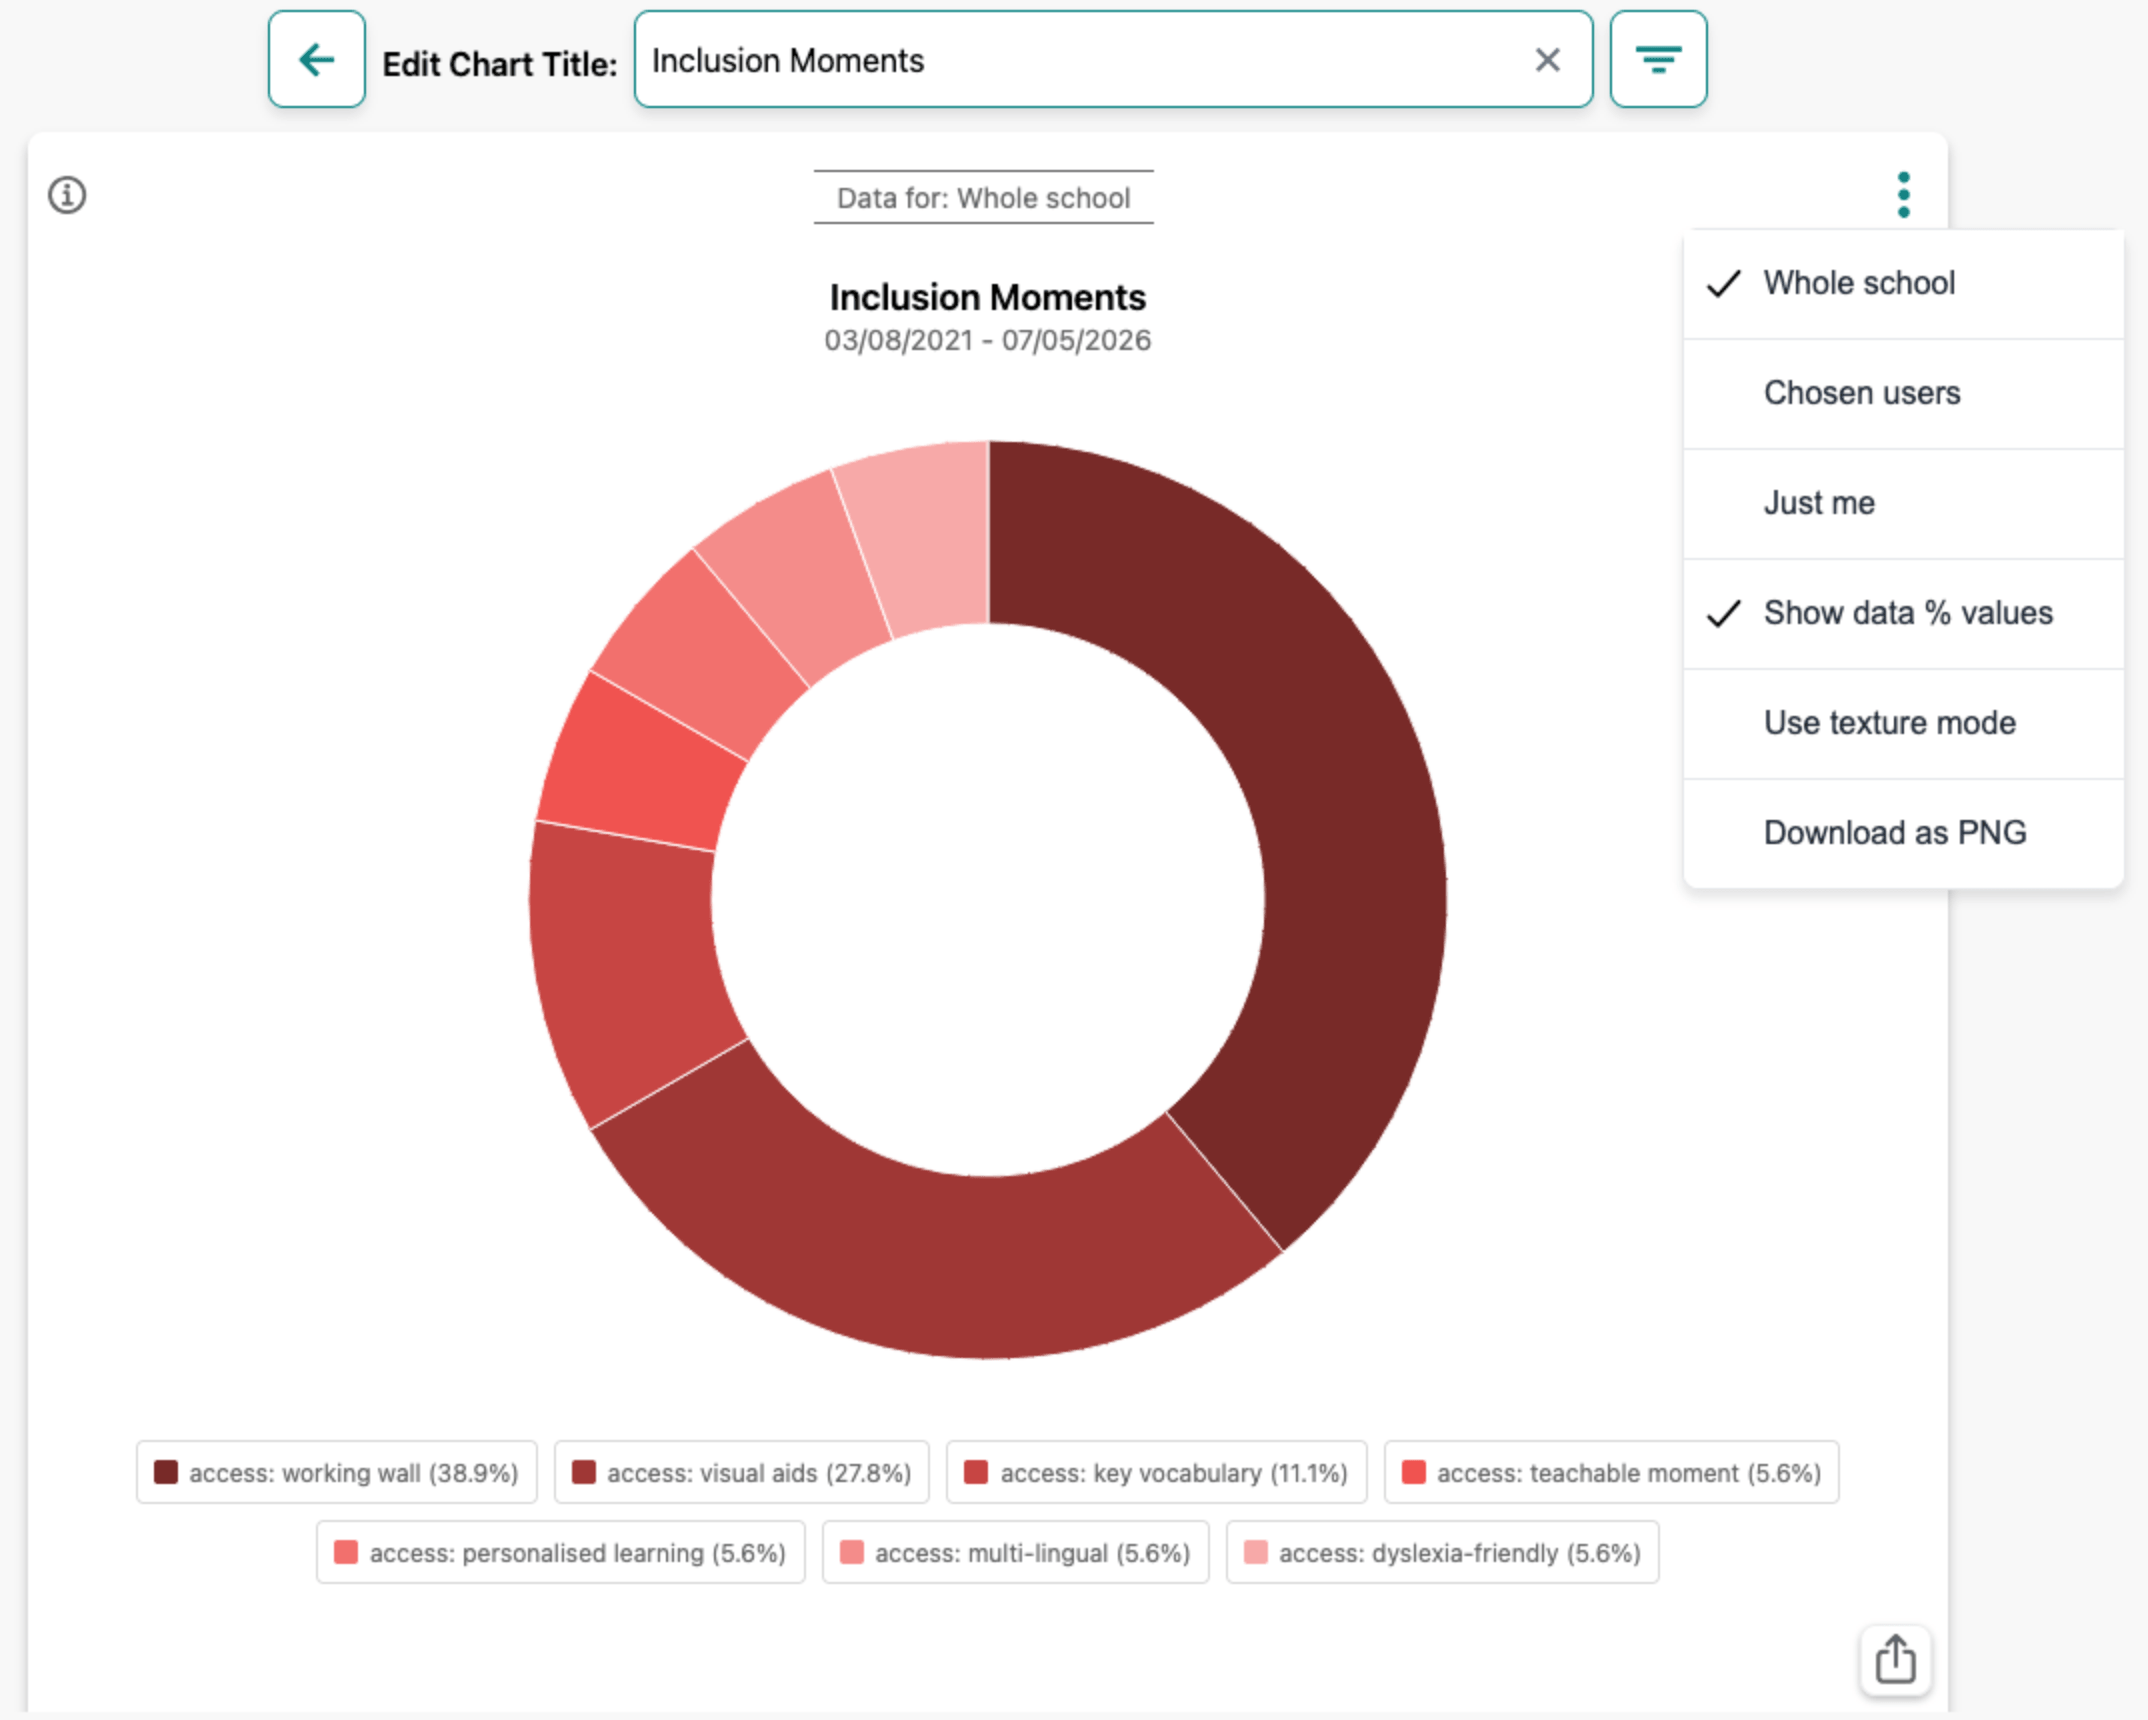
For senior leaders, the chart can help provide a quick overview of how SEND provision appears across the school’s evidence.
It may help leaders explore questions such as:
This can help guide further conversations with staff about how SEND support is being implemented and recorded. We hope you find this quick overview of the chart for SEND Provision and how it can be interpreted in Blippit Boards.
Write about something from your classroom and get structured thinking back - privately, in two minutes, with no sign-up.
Try a free reflection →No account needed. Not stored by Blippit.


